Evolution of exchange traded derivatives
Financial Express, 1 June 2009
Before derivatives trading began, NSE and BSE were all-electronic equity spot markets. By international standards, they were small markets. They had roughly equal market share.
Derivatives trading, which started in June 2000, was a turning point in many ways. The size of the spot and the derivatives business was qualitatively transformed as a consequence. NSE fared much better than BSE at derivatives trading. And after all these changes had fallen into place, NSE and BSE were both amongst the top 10 exchanges of the world, measured by the number of transactions.
In this article, we look more closely at the experience of NSE with derivatives trading, analysing the sub-components of turnover, measured in contracts per month. This is admittedly an imperfect measure, because all contracts are not identically sized. At the same time, this analysis does yield useful insights into the evolution of NSE.
Growth of the market
Derivatives trading started at NSE in June 2000. At the outset, there was only one contract: Nifty futures. Stock futures, stock options and index options were all prohibited. In June 2001, index options trading commenced. Stock options trading started in July 2001 and stock futures trading started in November 2001. Thus, the full set of equity derivatives products were only available in November 2001.
The 9/11 attacks on the World Trade Centre in the US were the first important event surrounding which index derivatives trading came to be of interest. In July and August 2001, Nifty futures trading amounted to 0.06 million contracts per month. This jumped to 0.15 million contracts in September 2001.
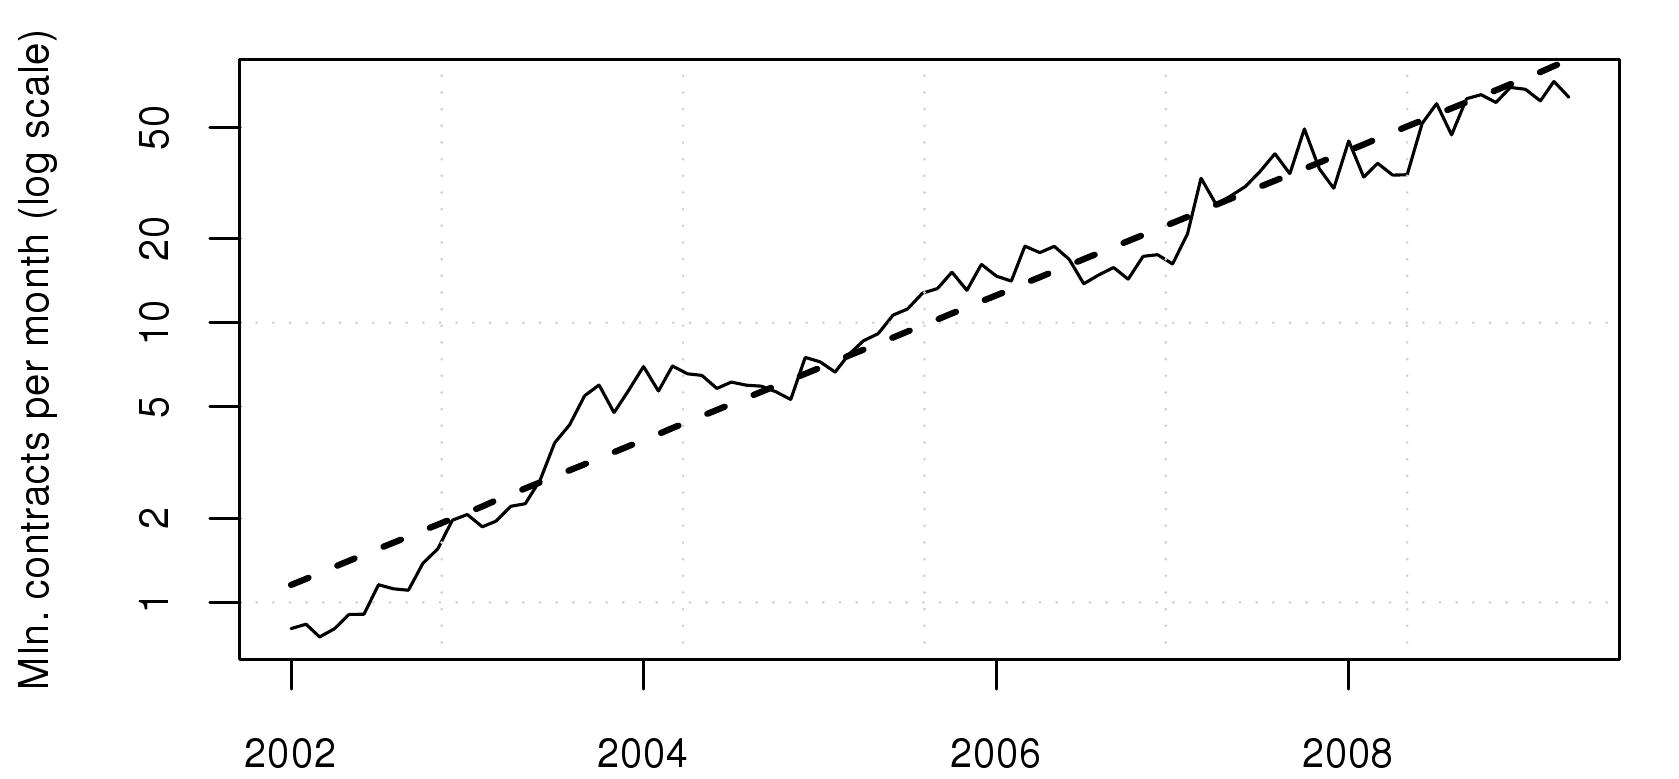 Starting from November 2001, the growth in the number of contracts traded at NSE has been remarkable. The figure shows this time-series, in log scale. The superposed time trend implies an average compounded growth of 5.1% per month. Few derivatives exchanges worldwide have obtained such a hectic pace of growth in the early years after launch.
The rise of options
 The first interesting distinction is that between futures and options. The figure shows the share of options in the overall derivatives trading at NSE. Options trading had a bit of a head start in the early days, since index options trading started in June 2001 and stock options trading started in July 2001. Hence, in the early months, individual stock trading was synonymous with options trading. Individual stock futures trading only began in November 2001. Individual stock futures trading took off strongly, and the share of options trading at NSE dropped all the way to below 10%.
Options trading is intellectually more complex than futures trading, so it is to be expected that market participants took more time to gain comfort, and build skills and systems to cope with options trading. In addition, the disproportionate aversion to options trading was influenced by two features of the institutional framework. NSE's tariff structure disadvantaged options, and there was a feature in the securities transaction tax (a turnover tax used in India) which penalised options trading. NSE modified its tariff structure in 2005 in order to address this. More importantly, the provisions of the securities transaction tax were modified on 1 June 2008. From late 2007 onwards, global financial market volatility went up dramatically, which might have increased interest in options trading (where payoffs can be controlled) as opposed to futures trading (where profits or losses are potentially uncontrolled).
These factors came together in 2008 giving a dramatic escalation in the share of option trading to values near 50%. The share of options in 2008 are understated to the extent that currency futures trading began, which bolstered futures turnover, but currency options trading was prohibited. Hence, the true shift in favour of options trading by the market is bigger than that portrayed in the graph.
The rise of index as the underlying
 The second interesting feature in the evolution of derivatives trading at NSE is the share of index derivatives in equity derivatives trading. In the early days, index underlyings had a head start because trading in index futures (from June 2000) and index options (from June 2001) started first. However, the magnitude of derivatives trading present at this time was very smal. In June 2001, only 0.035 million contracts were traded.
When stock options trading commenced (July 2001 and individual stock futures trading started (November 2001), they tapped into the pre-existing knowledge, interest, capability and order flow for badla, the mechanism for leveraged trading on individual stocks which had been banned with effect from July 2001. This order flow immediately switched to individual stock futures and options, and the share of index derivatives dropped sharply, all the way to 11.2% in April 2002.
In early 2002, the market had a new technique (options and futures) for expressing old ideas (views on individual stocks). The idea of trading an index was something new. Gradually, knowledge about the index percolated within the community, and the share of index derivatives went up to over 80% of the overall equity derivatives trading.
New macro underlyings
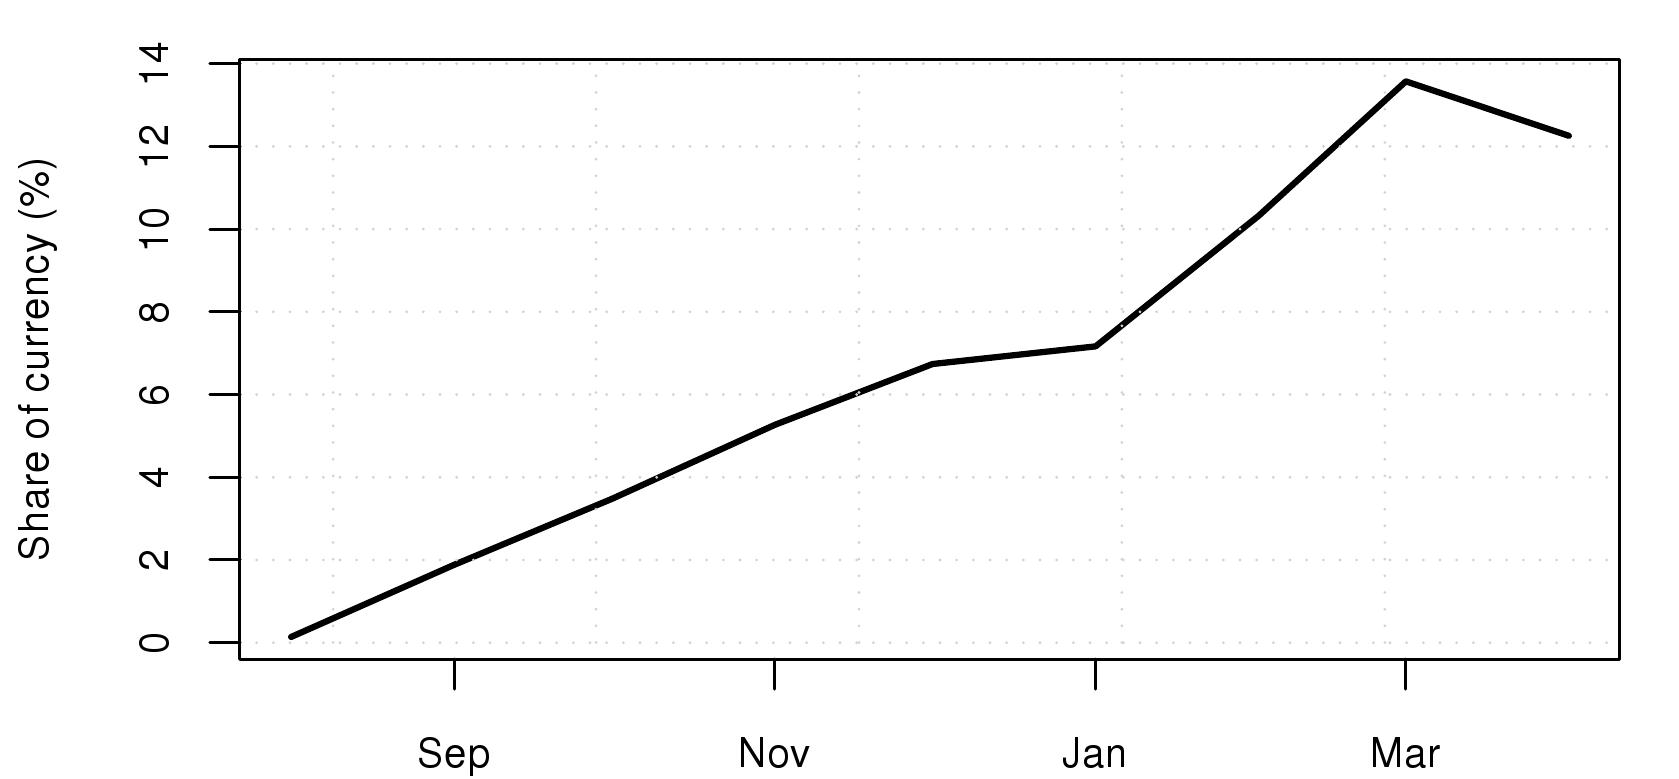 The third dimension in which we can obtain insights into derivatives trading at NSE is the shift away from equity derivatives. Currency derivatives trading commenced at NSE in August 2008 with a limited form of currency futures trading. At the time, trading was permitted in only futures on the rupee-dollar rate, options and swaps were banned, participations by FIIs and NRIs was banned. Yet, as Figure 4 shows, currency derivatives trading rapidly gained prominence at NSE, rising to above 10% of the overall NSE derivatives business within six months. In other words, roughly one-tenth of the business of the typical NSE member firm is now currency futures trading.
Back up to Ajay Shah's 2009 media page
Back up to Ajay Shah's home page