Tracking the economy using seasonally adjusted data
Financial Express, 20 July 2009
In India, many people use year-on-year changes of time-series in order to track the economy. This procedure has important weaknesses. The change from (say) May 2008 to May 2009 is actually the sum of a series of 12 different monthly changes. If we wanted to know what happened in May 2009, it would be more useful to look at the change from April 2009 to May 2009.
However, the use of month-on-month percentage changes runs into trouble in the form of seasonality. When the kharif crop comes out, food prices will be soft when compared with the immediate pre-harvest values. This softness is owing to seasonality and should not be interpreted as a genuine economic event.
The solution to this lies in `seasonal adjustment'. The world over, the first step that is undertaken is that of converting the `NSA' (non seasonally adjusted) series, i.e. the raw data, into the `SA' (seasonally adjusted) series. Once this is done, it is useful and meaningful to look at month-on-month changes. These yield a faster picture of what is happening in the economy.
Seasonal adjustment is normally done by the official statistical system of a country. In India, for atleast 20 years, there has been talk about seasonal adjustment. In recent weeks, we have established the procedures for computation and release of some seasonally adjusted series, at the URL http://www.mayin.org/cycle.in on the world wide web. These will be computed and released every Monday. On this website, graphs and seasonally adjusted data is freely released into the public domain.
All the graphs in this article show the average of the latest four months of annualised month-on-month changes. In short, this shows what happened in the economy in the last 4 months, as opposed to the familiar year-on-year changes which show what happened in the economy in the last 12 months. The term `SAAR' stands for "seasonally adjusted annualised rate" and the term `4mma' stands for "four month moving average".
IIP capital goods
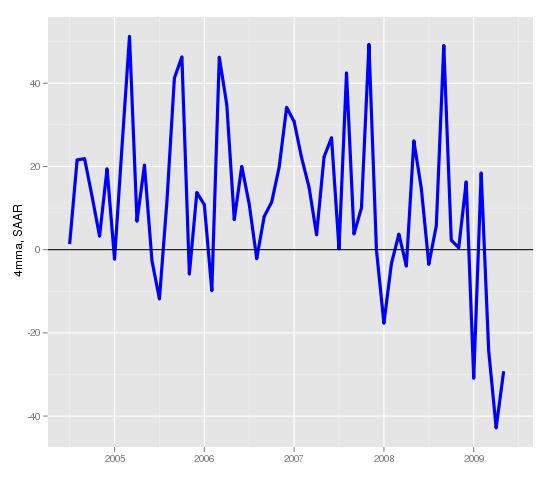 From the viewpoint of business cycle dynamics, one of the most important things to watch is investment demand. Fluctuations in investment demand, which respond to `animal spirits', matter greatly to Indian business cycle conditions given the large magnitude of private corporate investment as a proportion of GDP.
A key measure of this is the IIP capital goods. The last two values in Figure 1 show values of -42% and -30%. This means that twice in the most recent two months, IIP capital goods was shrinking at a rate of -30% to -40% per year. This suggests that a substantial investment decline is presently underway.
Non food credit
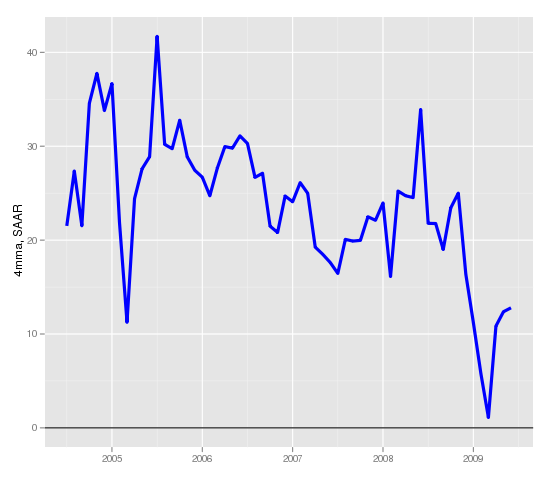 Growth in non food credit, shown in Figure 2, was running at very high levels when India was on the high of the business cycle. At the time, RBI was buying dollars, flooding the domestic market with liquidity, interest rates were low, and banks were stimulating the economy by giving out loans.
The growth in loans dropped all the way to roughly 0 a few months ago. This reflected three things:
- A decline in investment demand,
- A decline in working capital requirements owing to reduced prices of commodities, and
- Heightened fear of credit risk on the part of banks.
From there, there is a slight revival to modest values like 12% annualised.
Non oil exports
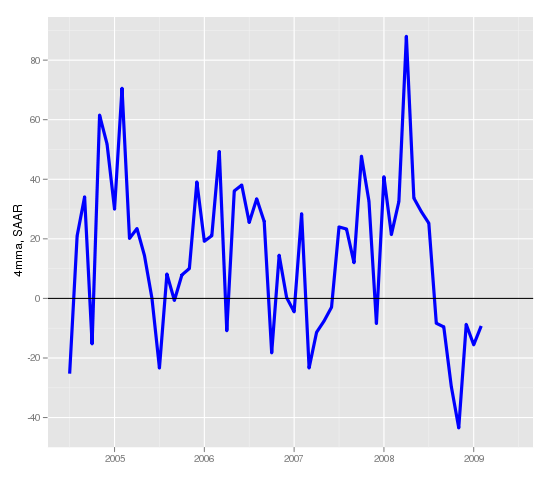 In addition to the demand shock of reduced investment demand, another demand shock which is hitting the economy comes from exports. Figure 3 shows the growth in non-oil exports. Many recent values have been negative. Each negative value implies that on average, in the latest four months, exports declined. The latest values show that exports continue to shrink at an annualised rate of roughly 10%. The worst point on this graph shows -42%, which means that there was one set of four months where on average, exports growth was -42% annualised.
Things have improved from there but only in the sense that exports are now shrinking at a lower rate. Exports growth has not yet commenced. The poor performance of exporting companies is one factor that is causing a decline in investment demand.
Wholesale price index
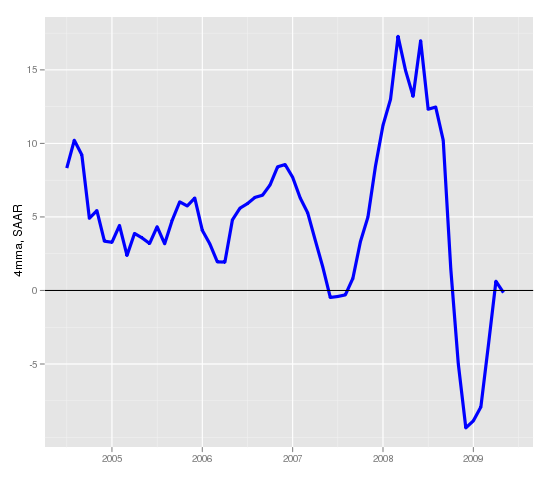 Finally, we turn to prices as measured by the WPI, in Figure 4. WPI inflation had risen to over 15% when the economy was overheating. At this time, monetary policy was supportive of expansion: real rates had become negative. From there, we had a dramatic collapse in inflation, and for a few months there was deflation. There are points in the graph which are near -10%, which means that for a four month period, WPI was dropping at an annualised rate of 10%. From there, the economy has pulled back to the two most-recent values of roughly 0. In other words, for the last five months, WPI inflation has been roughly 0.
If such conditions continue, and if WPI is a good measure of inflation, then interest rates in real terms are extraordinarily high considering that this is a downturn. It is ironic that real rates were low when business cycle conditions were pleasant and real rates have gone up when business cycle conditions have gone bad. This raises questions about India's monetary policy framework.
Back up to Ajay Shah's 2009 media page
Back up to Ajay Shah's home page