Signs of a thaw?
Financial Express, 20 April 2009
Stock market volatility
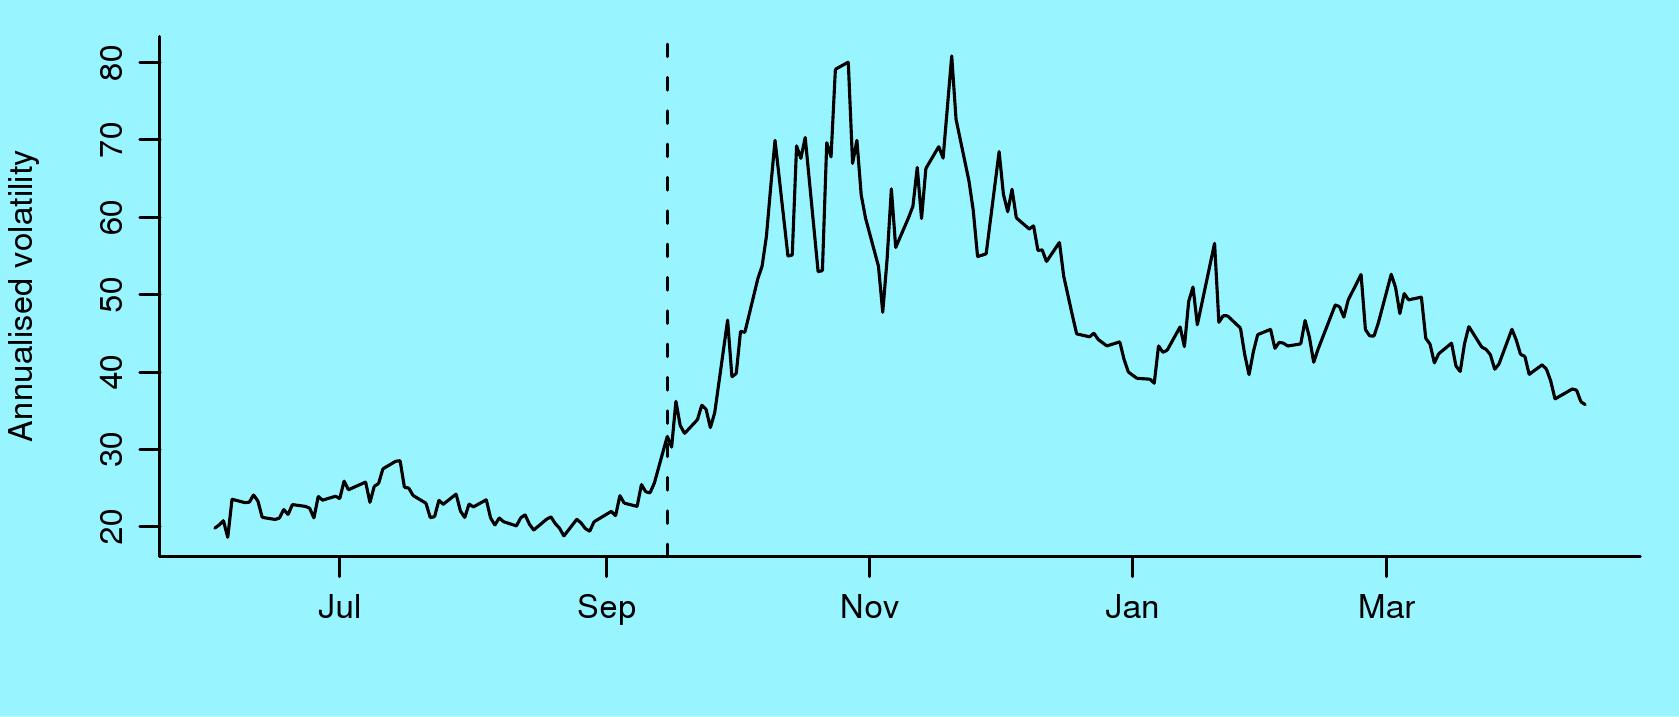 The figure shows the time-series of the `VIX', which measures the volatility of the US S&P 500 index. Vix is one of the best indicators of fear and uncertainty in the world economy. It is computed by backing out the volatility from observed prices of options. It shows modest levels of 20 to 30 percent per year in late 2008, but after Lehman died on 15 September, it rose dramatically to values like 80 percent per year.
Vix has, since, come down quite sharply. It is now showing values as low as 36%. While these are still higher than the pre-crisis period, the halving of Vix is the best sign that the unprecedented fear of the what might come next has subsided. Low values of Vix do not mean that things are good. It means that we are no long as uncertain, as compared with the dark days of October to December 2008, about how things will be. High values of Vix mean that while we observe a certain value of the S&P 500 index, this index is likely to bounce around a lot in the weeks to come. Conversely, low values of the Vix mean that the S&P 500 index will be more stable around the value that is seen.
This reduced uncertainty will make possible planning, investment, product launches, recruitment, etc. which is the foundation of the recovery.
Vix is directly important to India in two ways. First, it measures the uncertainty about the world economy, and lower uncertainty matters to the Indian economy, now that we are highly internationalised. The second channel of influence is from Vix to capital flows. High vix values are associated with low capital flows into India (and vice versa). The reduction in Vix is likely to yield improved capital flows into India.
The Moody's Baa credit spread
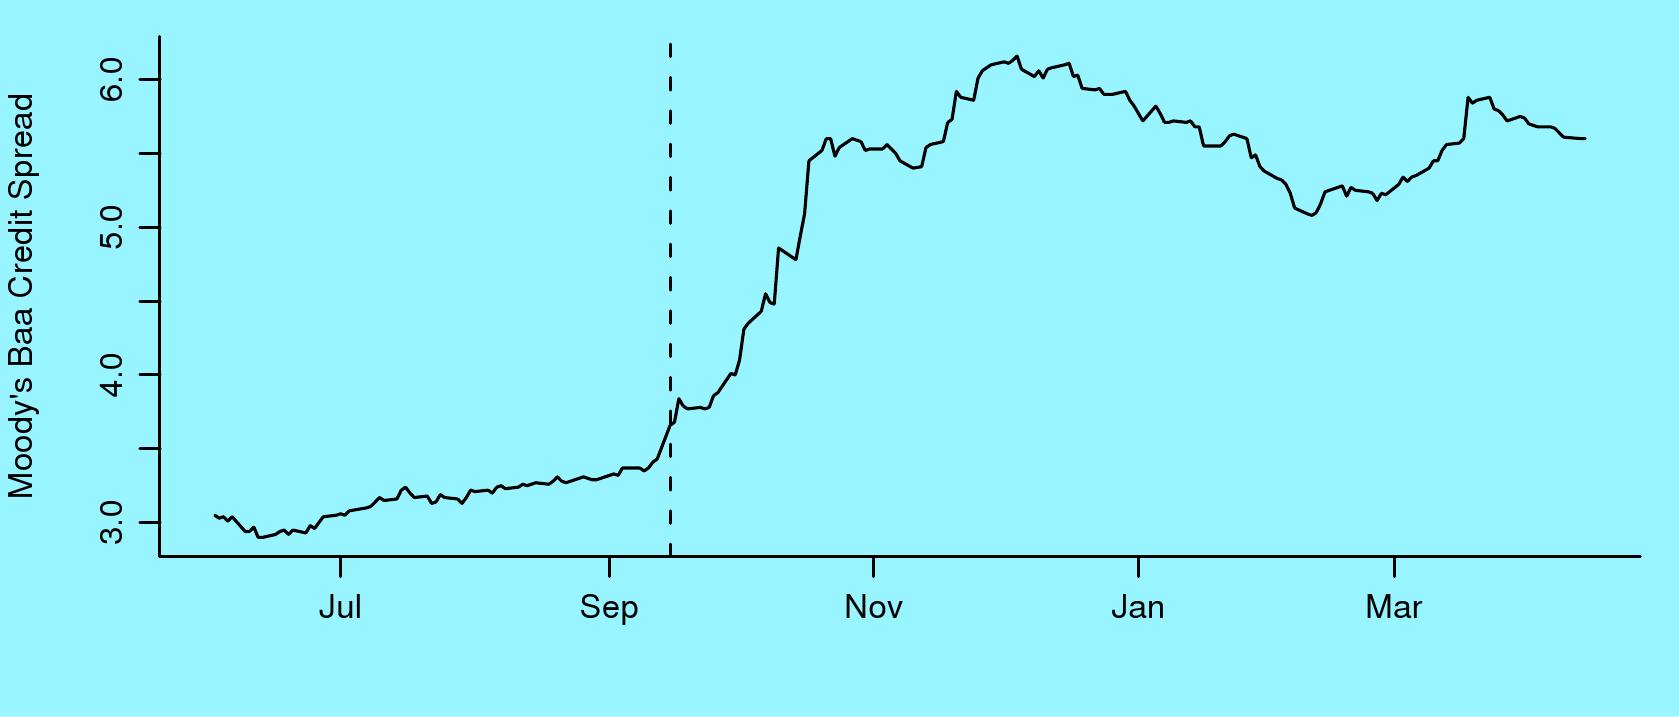 The second financial indicator which matters greatly to India is the Moody's Baa spread. It is the credit spread for bonds rated as `Baa' by Moody's, a credit rating agency. The Baa spread matters because it reflects the cost of borrowing of the best Indian companies, and because it is related to capital flows into India.
The figure shows that there has been only a slight reduction in the Baa spread. From the worst values of 600 basis points, it has come down to values like 550 basis points. While this is a reduction, it is not a sharp change in credit market conditions. Unlike the Vix, this is not showing a big change.
The Indian and the US stock market indexes
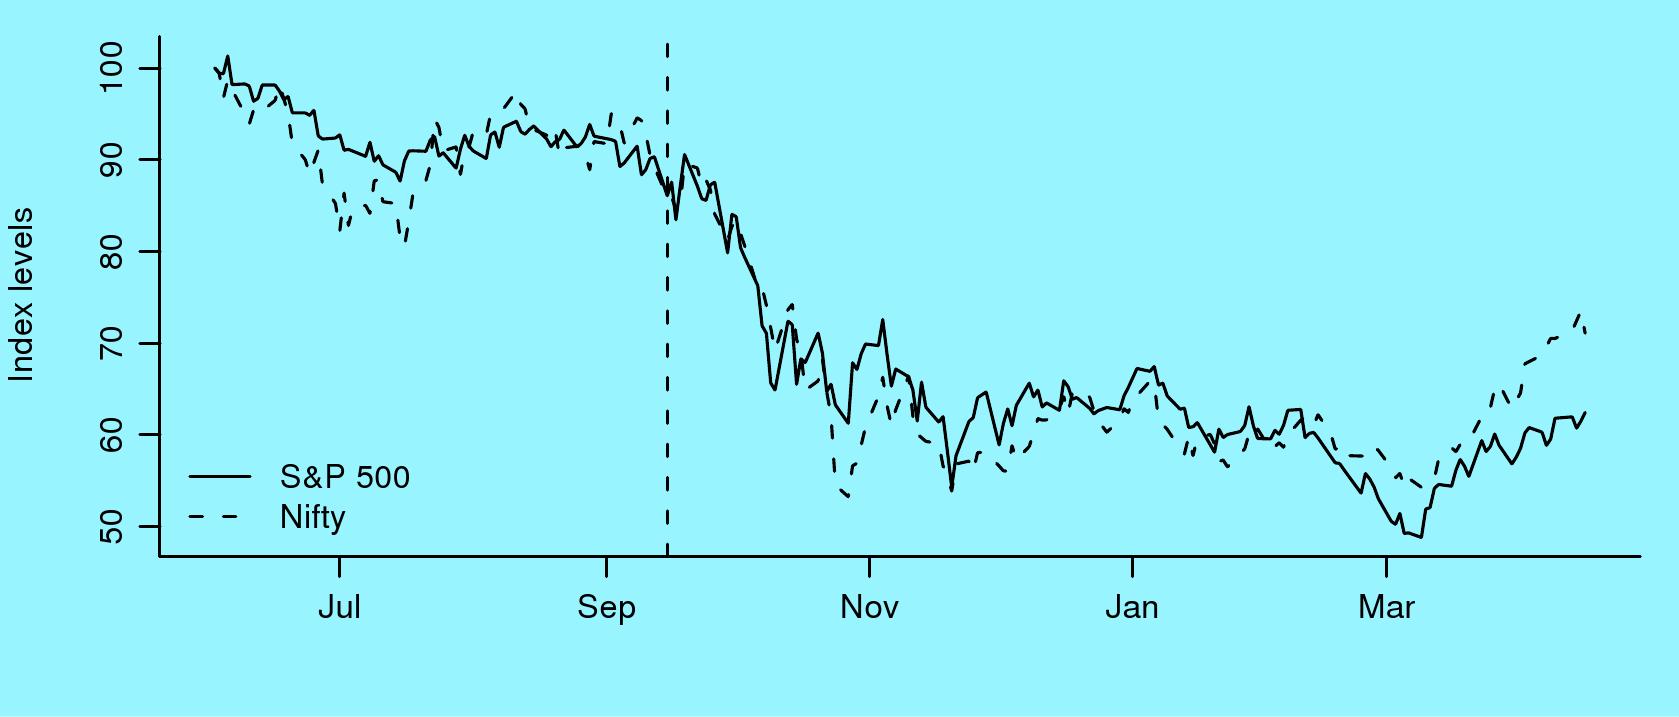 The figure here superposes the US S&P 500 index, and the Indian Nifty index. Both indexes are rescaled to start from 100. The almost identical movements of the two indexes are astonishing and much unlike traditional experience.
This is related to the substantial exposure of Indian companies to the world economy. For some companies like Infosys or Reliance, it reflects substantial exports. For other companies like Tata Motors or Tata Tea, this reflects the fact that they are now multinationals with over half of their productive assets outside the country.
Both indexes halved from the starting value of June 2008 to the bottom of March 2009. From there, both indexes have recovered. The recovery of Nifty has been more impressive. This recent recovery is the first place in the graph where the two indexes are showing significant discordance.
The US dollar
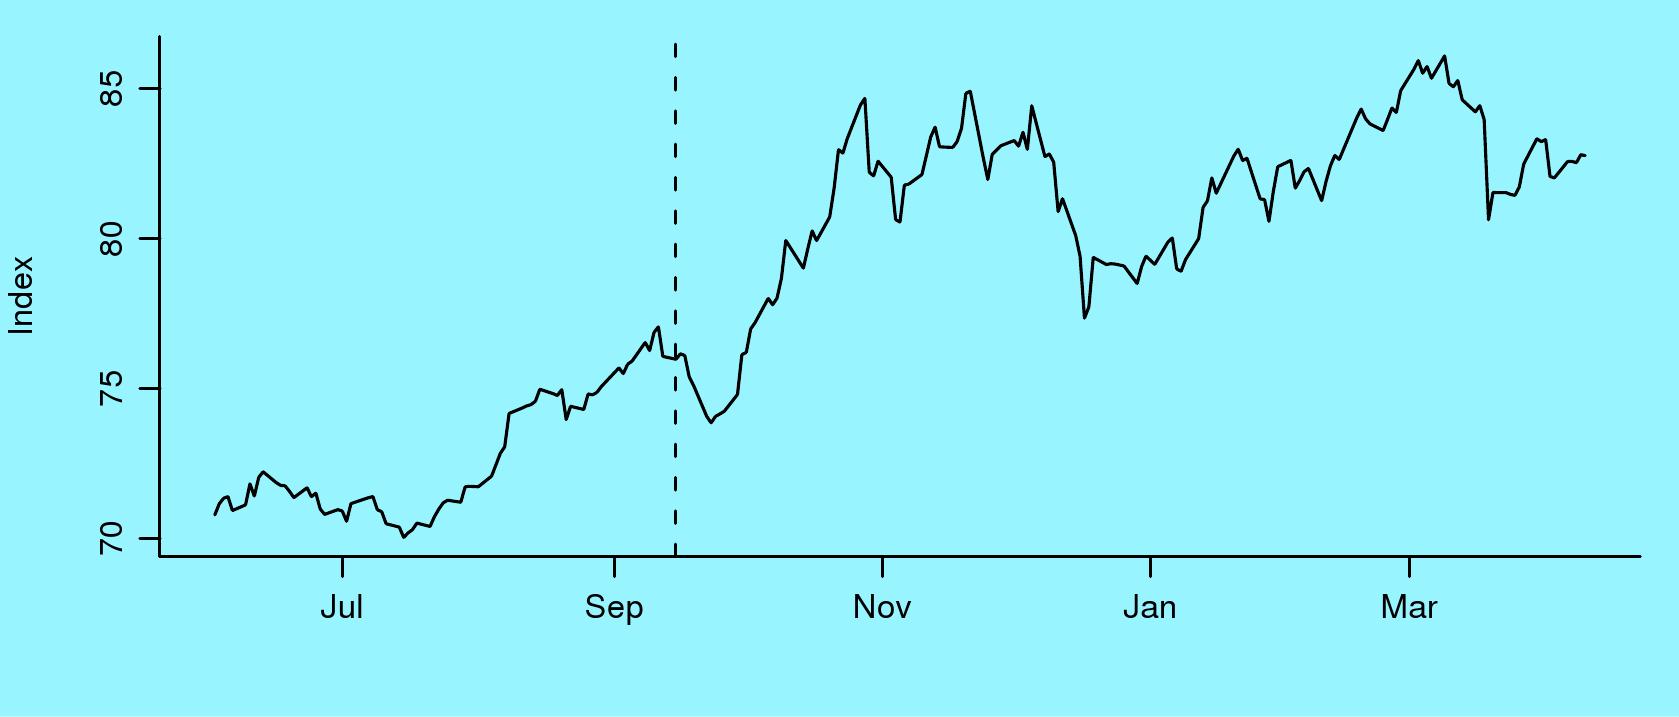 The last figure shows an index of the value of the dollar (the "major currencies index" produced by the US Federal Reserve). When the global financial crisis came about, the fear in the minds of investors the world over led to a flight of capital to the safest country (the US) and particularly the safest assets (US government bonds). This gave a dramatic appreciation of the US dollar, from an index value of 70 to an index value of 85, an appreciation of 20%. Much of the depreciation of the rupee against the dollar that we have seen in recent times reflects the fact that the USD, the yardstick against which we measure the rupee, changed.
From this peak, the USD has lost a little ground. But as yet, the USD depreciation has not been substantial.
What comes next in restoration of normal conditions on financial markets
In summary, we are at the beginnings of the revival of financial markets after the crisis. The Vix has come down sharply, which bodes well. But other aspects of finance have not yet sharply improved.
The defining issues for the next phase of the recovery are now the revival of the credit markets (which will yield a reduced Baa credit spread) and capital flows out of the US, back into the rest of the world (which will yield a weaker dollar).
What comes next on the economy
It is important to maintain a distinction between what financial markets say and what is going on in the economy. Financial markets contain forecasts of the coming months. As an example, earnings forecasts of the companies in Nifty over the coming two to three years shape the valuation of Nifty today. The fact that Nifty has yielded positive returns means that these forecasts have improved somewhat. This does not suggest that the earnings of corporations have bottomed. And, it is important to remember that the stock market indexes are still far below the values of a year ago.
The economic downturn in the US is likely to continue through 2009 and 2010. Economists know relatively little about how such a deep and globally synchronised downturn will play out. We will be surprised if a quick recovery comes about. A pessimistic scenario, with a slow and painful recovery spread over 2009 and 2010, is more likely.
Back up to Ajay Shah's 2009 media page
Back up to Ajay Shah's home page